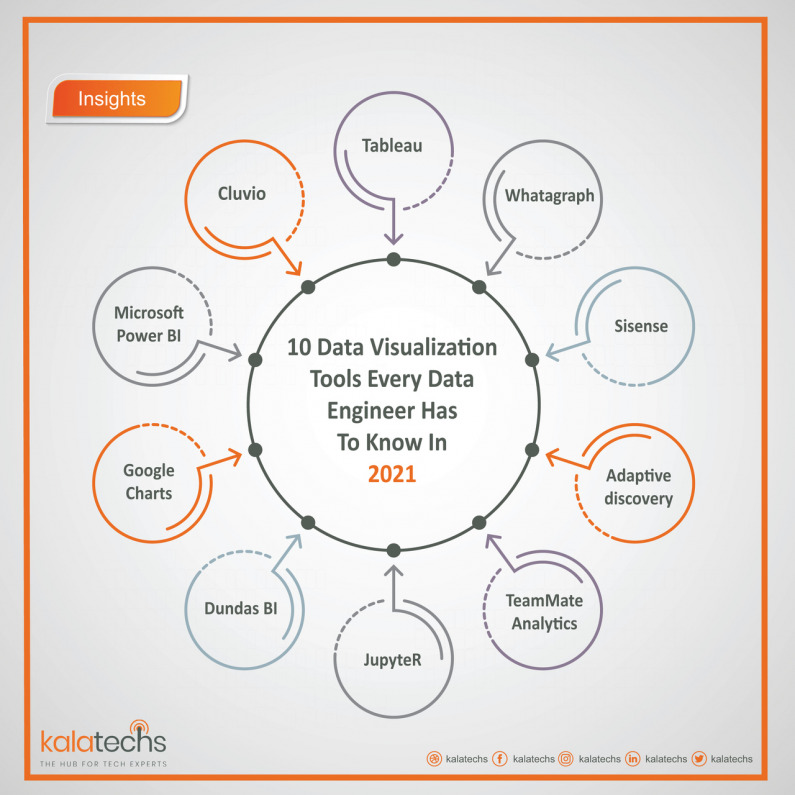
10 Data Visualization Tools Every Data Engineer Has to Know in 2021
Mar 25,2021
On a simple level, data visualization is not difficult and can be performed in a notebook. Even the most inexperienced person may create basic charts in Excel or Google Docs to demonstrate how measurements adjust over time or in response to specific variables. However, devel...