


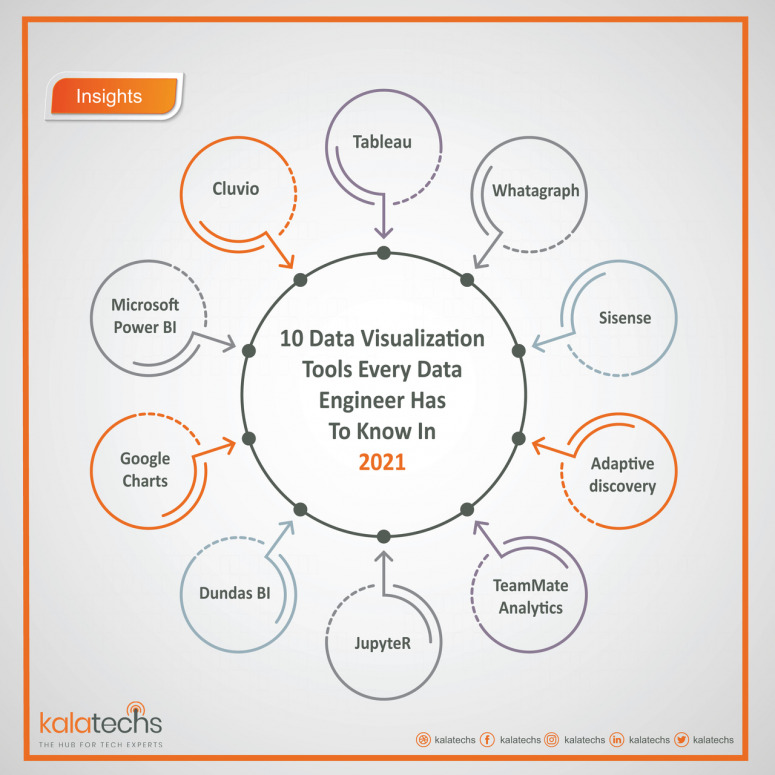
10 Data Visualization Tools Every Data Engineer Has to Know in 2021
Mar 25,2021
On a simple level, data visualization is not difficult and can be performed in a notebook. Even the most inexperienced person may create basic charts in Excel or Google Docs to demonstrate how measurements adjust over time or in response to specific variables. However, developing a tool that can manage large amounts of data and information from various sources is a difficult task. Although the most basic methods for visualizing data are found in the most common office suites, true business intelligence can be accomplished with a variety of advanced tools with varying features and costs. So, in order to stop being stuck in this labyrinth, we've assembled a list of data visualization resources for you!


